Visual Studio and VS Code Tips and Tricks
A colleague mentioned they weren’t aware of Logpoints in Visual Studio, so here’s some things that aren’t on or known about by default (usually because they’re experimental or stylistic)
Some that I’ve found useful:
- Logpoints
- Cursor animations
- Semantic highlighting
- Parallel stacks
- Output window filters
- Unreferenced assembly Intellisense
Visual Studio #
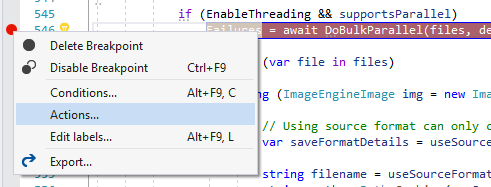
Logpoints #
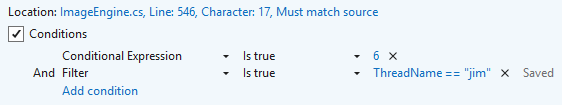
Fancy addition to breakpoints. Many people know about the conditional option, but you can also add some other things, like writing to the console and not breaking, looking for a specific thread, or conditionally being hit a set number of times (for weird debugging that happens only at certain execution count…I guess)
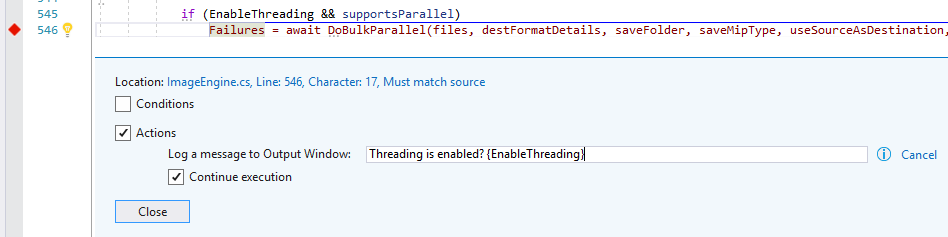
Another thing I used a logpoint for was when I didn’t know which part of a function was slow, and instead of relying on the Visual Studio step timer (works sometimes, but weird in Debug mode), I had a stopwatch start counting at the top, then added logpoints to write out all the timings.
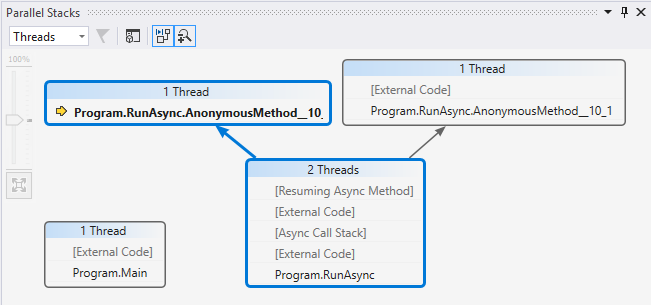
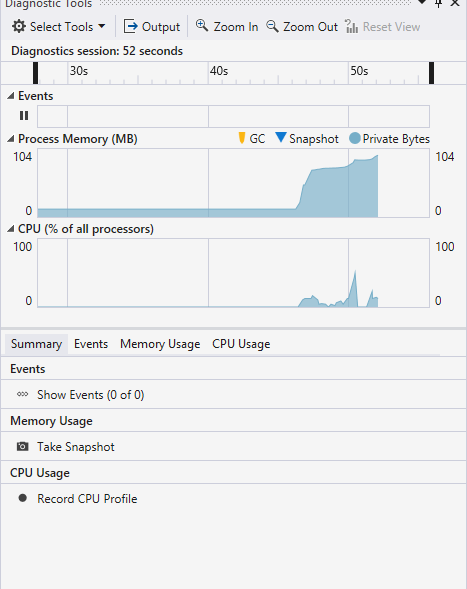
Parallel Stacks #
A prettier way of seeing the call stack. Also helps visualising the actual work the application is doing at the time.
This is also a good time to bring up the performance tools next to it as well :)
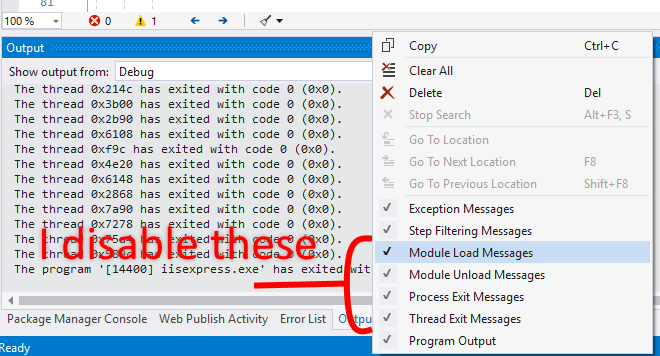
Output Window Filtering #
By default, the Output window spits out all sorts of garbage like thread exits, module loads, etc. Most of the time, no one needs to see that stuff, so you can filter it out!
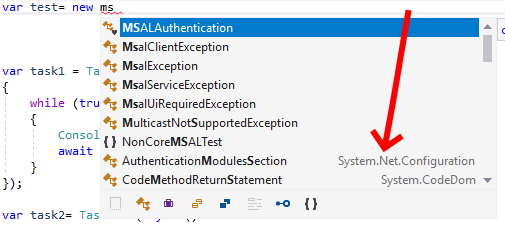
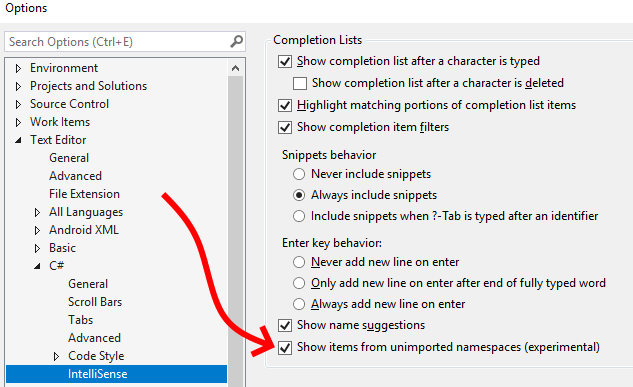
Experimental Intellisense Suggestions #
Something recently added was the ability for Intellisense to suggest items that aren’t referenced. Selecting one such suggestion adds the using statement to the file.
Keyboard Shortcuts #
Shift + Enter: Adds and moves to a new line below the line you’re on. This usually correctly terminates a line with a;as well.Shift + Alt + =andShift + Alt + -: Expands and contracts the selection of the current block. e.g. with your cursor in the body of anifstatement,Shift + Alt + =selects the wholeifblock. Hitting it again, selects the encompassing block, and so forth.Ctrl + [, S: Find current file in the Solution Explorer.- Multi-caret support is still a thing, with box select
Hold Alt + left mousebut also withHold Alt and Ctrl + click left mouseso you can place carets anywhere for editing. Shift + Alt + ;,Shift + Alt + .,Shift + Alt + ,: Add cursors to all matches, add cursor to next match, remove cursor from previous match.- There’s a new pinning feature for the debugger! It behaves similarly to the
DebuggerBrowsableAttributebut at debug time instead of build. Instead of seeing{SomeObject}, you can open its properties and pin one, and see{Property = val}instead!
Visual Studio Code #
I sometimes found it hard to track where the cursor was when I was quickly moving it around, like sometimes I’d scroll and not really notice how far I’d scrolled, etc.
A bit weird, sure, but there was a solution to my weirdness.
Smooth Scroll and Cursor Animations #
There’s settings for smooth scrolling (can be a bit of a performance hit), and animations for the cursor blink (some crazy ones like pulse and vertical grow), and the transition for the cursor moving to a new location.
Both of these are found in the standard settings but are too spaced out to put here.
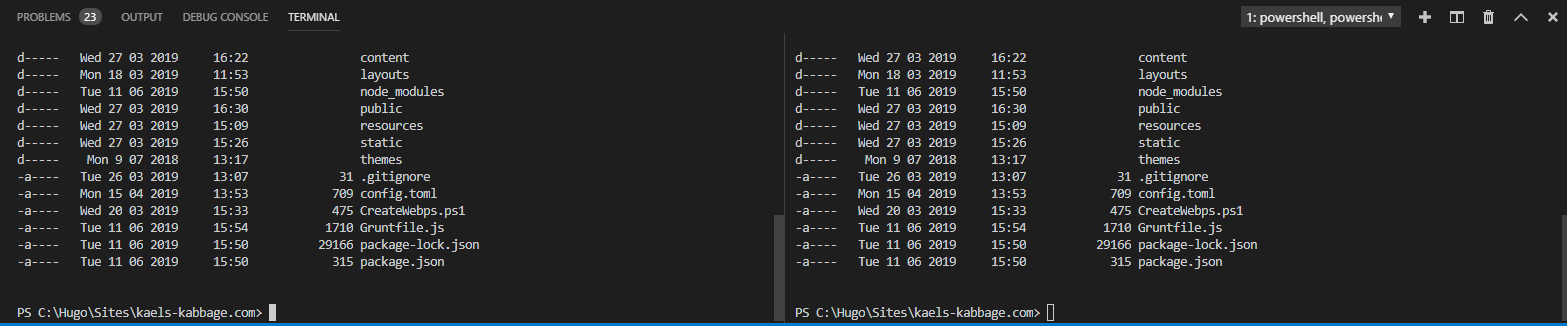
Split Terminals #
I don’t see enough people using this. It’s especially great for multi-root workspaces.
Semantic Colourisation #
There’s an extension called
bracket pair colourizer 2 which highlights bracket pairs, indented code, etc to make it a bit easier to visually parse code.
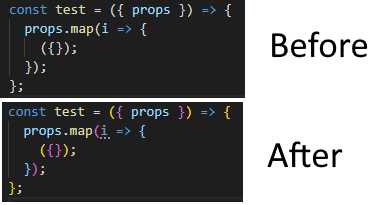
As of 2019, Visual Studio does this to an extent as well.
BONUS! Azure Data Studio #
Since Azure Data Studio is built on the same engine as VSCode, many of it’s tips work here too! I’ve got cursor animations and smooth scrolling enabled.
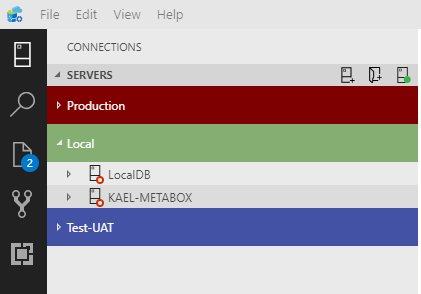
Grouped Connections and Tab Backgrounds #
Connections in ADS can be grouped together in whatever ways you’d like. I’ve got mine grouped by UAT, Local, and Production since I don’t have enough connections per client to warrant grouping by client.
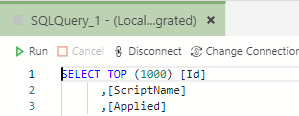
This is super handy when you open tabs from each connection as there’s a setting to highlight the tab background to easily visually distinguish between groups!
There was also a
recent post from Visual Studio themselves.
Enjoy!